
ABC to CTR…
Understanding social media metrics is key to unlocking your potential online and ensuring your social posts have the best chance of cutting through.
Social media is a data-rich environment, but you shouldn’t be afraid to explore it.
Social media metrics can take time to get your head around. It doesn’t have to be that way, so why is understanding it all so hard?
Many analytics platforms appear intimidating, but things get much easier once you understand the terminology.
TLDR: Everything to know now
Why track social media metrics
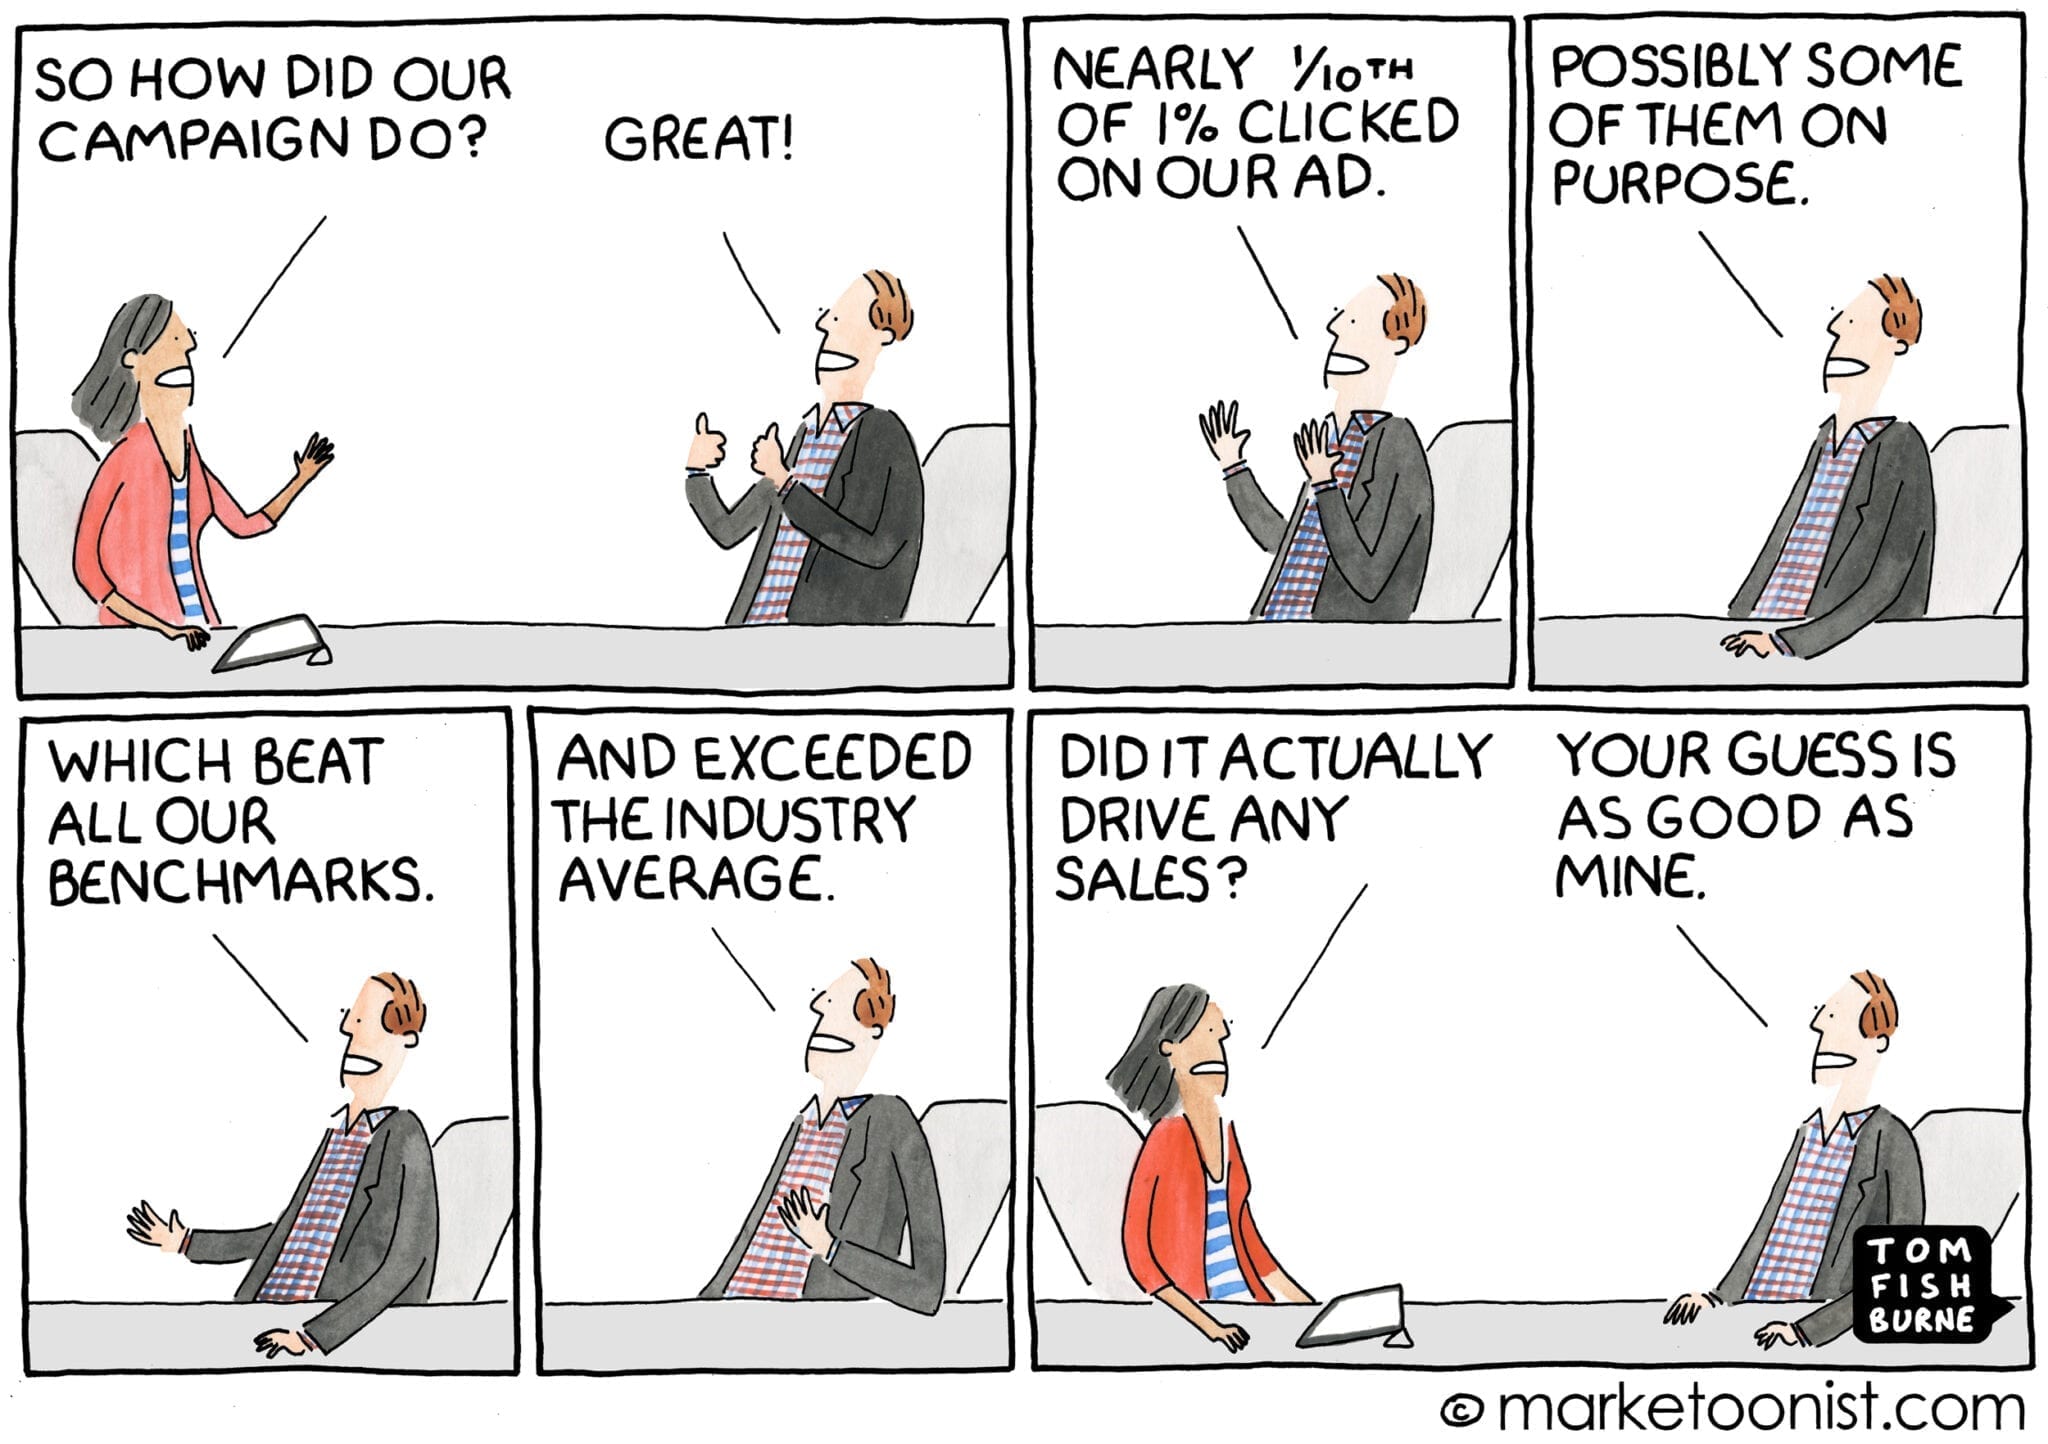
If you are spending money on a marketing campaign, you need to know how it is performing— you want to know how effective it is, right? Measuring this performance means looking at your data and understanding the metrics.
Tracking metrics is crucial to ticking off your goals. When you set your goals, align them with your business objectives to better understand the ROI (return on investment).
The idea behind this is to prove, with solid evidence, that social makes a valuable contribution to the business. You can compare it to your efforts on other marketing channels, such as email and paid search advertising and help inform the budget allocation.
What metrics to track
If you’re new to this, knowing exactly what to track can be overwhelming. Let’s take a quick look at some of the most common metrics you are likely to find on social media.
Organic Metrics
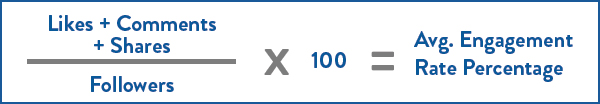
Engagement Rate
Engagement is an umbrella term representing how well your audience responds to your social media content. Across platforms, you’ll often see Engagement Rate as a critical metric. All this means is the number of post engagements divided by impressions or reach.
Impressions and reach
Impressions and reach are easily (and often) confused social media metrics, so break them down separately.
Impressions: how many times your post appear on someone’s timeline/feed.
Reach: the potential number of unique viewers your post may have. This is often your follower/like count plus the follower/like count of accounts that shared your post.
Advertising Metrics
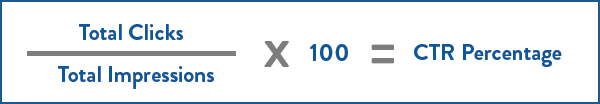
Click-through rate (CTR)
The number of clicks your ad or post receives is divided by the number of times that your ad is shown. You’ll see CTR across every social media platform. While it’s a primary stat, it’s crucial to understand, at a glance, just how effective your ads are.
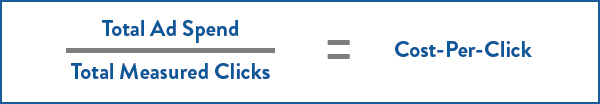
Cost-Per-Click
A paid advertising term that refers to the actual price you pay for each click in your pay-per-click (PPC) marketing campaigns. Every click in a PPC campaign represents attention from someone searching for something you offer.
Remember these definitions the next time you’re stressed while checking your social media stats.
Hot tip: it’s also important to keep an eye on your audience growth (gained vs lost follwers), watch rates, saves, shares, and the best times to post content on social media.
How do I track social media metrics?
Every social media platform has its analytics platform for tracking metrics. For most users, these in-built tools are all you’ll need and offer more than enough information.
The most robust native platform is Meta Business Suite; however, LinkedIn, TikTok, Pinterest, YouTube, and more have tools to help you track social media metrics.
👉 Hot tip: we love using Iconosquare. It’s feature-rich and easy to use.
Do a bit of a Google, find the analytics for the platform you’re working on and when you get stuck, look for their help section. Fingers crossed, things aren’t out of date.
Using the insights
Now that we understand social media metrics, let’s consider when and how you should use them.
Analysing your campaign data lets you learn about your customers and their behaviour. The analytics platforms will allow you to see which pages of your website they visited and for how long, which helps you understand what they want and what they crave.
By looking at your audience’s online behaviour, you can gain valuable insights into the content they like and are most likely to engage with. You can then use these insights to help inform your future content creation and marketing campaigns and ensure you aren’t wasting your budget on content that doesn’t appeal.
Need more help starting out with social media? Check out our Developing a Social Media Strategy webinar!
Enjoyed this article? Enter your email below for social media tips & tricks delivered to your inbox every Monday morning.
** This post may contain affiliate links. While we do only recommend products that we believe in, let’s be honest here – we’re in marketing, too, and everyone loves an affiliate link!